Wednesday, 31 August 2011

The average American Apple household has 4 Apple devices

"Frequent mobile video users will more than triple over the next five years
Nearly 50% of 18 to 24 year old smartphone/tablet owners frequently social network about TV programs currently being viewed
86% of smartphone/tablet users will view video on their mobile devices
Nearly 60% of smartphone/tablet owners will also be viewing OTT (over-the-top) video at home
The average Apple household will have four Apple devices, while the average Google Android household will have at least two Android devices"
Source:  Research by In-Stat, reported in a press release, 30th August 2011

Britain's top tourist attractions get 5 times as many checkins on Facebook as on Foursquare

"The data, which uses all the check-ins at UK attractions since November last year, found that check-ins on Facebook to the top 50 UK attractions totalled 955,437, while check-ins on Foursquare reached 176,724.
Betapond, the agency that developed the Love UK Top 50 Places app, said the data showed that Facebook was by far the check-in method of choice for the mainstream web audience.
The data is taken from a campaign VisitBritain launched in November last year to find the top UK attraction, based on location-based check-ins (nma.co.uk 8 November 2011). The aim for the tourist board was to add a competitive element, encouraging attractions to promote check-ins to its visitors. Over the period of the campaign the Love UK page has gained over 450,000 Likes and helped to accumulate over 1m check-ins at the top 50 UK attractions.
The top UK attraction is currently The O2 stadium with 72,817 Facebook check-ins and 7764 check-ins on Foursquare."

Friday, 26 August 2011

Wordpress powers nearly 150,000 of the world's top million websites

"This has been an exciting year for WordPress. We’ve grown to power 14.7% of the top million websites in the world, up from 8.5%, and the latest data show 22 out of every 100 new active domains in the US are running WordPress."
Source:  Blog post by Wordpress, 19th August 2011

Pandora posted a loss of $1.8m in Q2 2011

"The Oakland firm reported a 117% increase in revenue from a year earlier to $67 million as advertising and subscription sales grew.
The company, however, continued to lose money, posting a $1.8-million loss, or a loss of 4 cents a share, for the quarter that ended July 31 compared with a $1.6-million profit, or 4 cents, a year earlier.
Adjusting for stock compensation costs for its executives and other special expenses, Pandora posted $3.3 million in net income, compared with $2.6 million a year earlier. Analysts had expected Pandora to break even for the quarter on $61 million in revenue."
Source:  LA Times, 25th August 2011

Google's +1 button gets 4bn impressions a day

"In June we launched the +1 button for websites, making it easier to recommend content across the web. In July, the +1 button crossed 2 billion daily views, and we also made it a lot faster. Today the +1 button appears on more than a million sites, with over 4 billion daily views, and we're extremely excited about this momentum."
Source:  Google blog, 24th August 2011

Thursday, 25 August 2011

Years taken to achieve 50% penetration in the UK


Click to enlarge

Source:  The UK Communications Marketplace Report, Ofcom, August 2011

Tuesday, 23 August 2011

Two thirds of US Tablet owners have used the device to watch full-length movies

"A recent study of over 1,400 U.S. consumers conducted by Boston-based custom research firm, Chadwick Martin Bailey found that smartphones and tablets are not only more popular than ever, they are replacing relatively new technology like portable gaming systems as well as devices that have long resisted substitution like TVs and laptops.
The increase in quality and capabilities of mobile devices has sparked major changes in consumer habits. For example: over half of smartphone and tablet users play games on their device and two-thirds of these people are using other devices less for gaming (particularly portable gaming systems). Additionally, nearly two-thirds of tablet owners have used these devices to watch feature-length movies. As tablets become more mainstream, the data indicate that stand-alone DVD players will go the way of the horse and buggy.
“The increasing ubiquity and capabilities of smartphones, tablets and the mobile networks that support them is having enormous implications for the entertainment and consumer electronics industries,” says Chris Neal, Vice President of Chadwick Martin Bailey’s Tech and Telecom Practice. “Content owners and advertisers of all stripes stand to benefit, while many specialty device manufacturers will need to course correct if they haven’t already.”"
Source:  Data from Chadwick Martin Bailey, reported in a press release, 18th August 2011

42% of American Millennials like to watch TV mainly online

"Millennials Consume 42 Percent of TV Online
Millennials [16-34s] appear to have substituted television and print media for the increased online activity and media consumption. Millennials watch significantly less TV than Non-Millennials; fewer Millennials report watching 20-plus hours/week (26 percent versus 49 percent). When they are not watching live TV, Millennials are much more likely to watch shows mainly on their laptops (42 percent versus 18 percent), with DVR (40 percent versus 36 percent), or On-Demand (26 percent versus 18 percent).
Millennials Seek Peer Affirmation & Advice
Perhaps because of their need to share and to find commonalities, 70 percent of Millennials reported feeling more excited when their friends agreed with them about where to shop, eat and play. Only 48 percent of older adults were as heavily influenced by their friends and colleagues. Additionally, Millennials gather information on products and services from more channels - more Millennials than Non-Millennials reported using a mobile device while shopping to research products (50 percent versus 21 percent)."
Source:  Research from “American Millennials: Deciphering the Enigma Generation.” by Barkley with Service Management Group and the Boston Consulting Group, quoted in a press release, 18th August 2011
Methodology:  "Based on a survey of more than 5,000 respondents and 3.9 million data points, the study provides new information on a range of digital and social media habits of American Millennials as well as their attitudes in the areas of cause marketing, grocery, restaurant, apparel and travel."
Note:  For this study Millennials are defined as 16-34s year olds

Larger ad sizes tend to generate greater response

"Larger ad sizes tend to generate greater response. Size does matter apparently. As we have seen in years past, bigger ads perform better. We observed this with the latest set of metrics in which the half-page ad unit (300x600) which had the highest CTR, interaction rate (for both in-page and expandable formats) and expansion rates of all the available creative sizes we tracked for the benchmarks.
Although the U.S. had one of the lowest expansion rates, this market showed the highest expansion time. So Americans seem to expand ads less but when they do spend more time engaging with the ads themselves.
In terms of industry verticals, auto advertisers performed the best in terms of CTR (0.13% for flash ads) but conversely had the lowest interaction (1.9%) and expansion rates (0.2%). For interaction rate, telecom (9.4%) and B2B (9.2%) advertisers were the highest while B2B stood out in terms of expansion rate (7.5%) benchmarks."
Source:  Global data from DoubleClick, revealed in a blog post, 16th August 2011
Methodology:  "A couple of notes about this latest set of online advertising benchmarks. The data for these benchmarks are derived from a robust data set across DoubleClick for Advertisers, based on rigorous methodology with input from the Advertising Research Foundation. The charts cover global benchmark figures for the entirety of 2010 by ad format, ad size and industry vertical. The benchmarks are normalized across hundreds of advertisers, thousands of campaigns, and tens of billions of ad impressions."

Monday, 22 August 2011

As many people in the UK plan to buy a tablet as plan to buy an HD TV in the next year

"The relationship between watching television and shopping online will get even closer in 2011, according to a Deloitte report, with fieldwork done by GfK, on behalf of the MediaGuardian Edinburgh International Television Festival, which takes place between 26–28 August 2011. Deloitte and GfK’s survey of 4,000 UK citizens found that as many consumers plan to buy a tablet computer as a new HD television in the year ahead, 13 per cent.
The tendency to watch television while browsing the Web has grown in popularity. Over half of the survey’s respondents now browse the Web while watching television. Only 22% never do so. In 2010, 39 per cent of all respondents never used the Web and television concurrently and, of those who did, about half did so only occasionally."
Source:  Data from Deloitte & GfK, published in a press release, 22nd August 2011

Friday, 19 August 2011

Spotify has 1.5m paying subscribers

"At the end of June, Spotify had more than 1.5 million paying subscribers for its streaming music service, according to a report prepared for a rightsholder and subsequently seen by Music Ally, which outlines the company’s performance between January and June this year. Spotify did not leak the report to Music Ally, and has declined to comment.
The report clearly identifies a surge in subscriptions after Spotify introduced restrictions on its free service at the start of May, including a 10-hour monthly listening limit and a five-play cap on individual tracks. The changes came at the behest of some of Spotify’s major-label shareholders, who wanted to see an uptick in the company’s conversion rate of free to paid users.
They certainly got that. Music Ally can reveal that between March and June this year, Spotify lost 1.6 million free users, but gained 644,000 520,000 paying subscribers.
Here’s how that breaks down: In March, the company had 4.73 million free users and 1.02 million paying subscribers, with a total active user base of 5.75 million, of whom 17.8% were paying. Then the restrictions were announced in mid-April and implemented on 1 May. By June, the leaked report reveals that Spotify had only 3.13 million free users, but 1.54 million paying subscribers: 32.9% of its 4.67 million active users."

The growth of Flickr


Click to enlarge

"22 Oct 04: 1,000,000
20 Apr 05: 10,000,000
15 Feb 06: 100,000,000
22 Sep 06: 250,000,000
15 May 07: 500,000,000
19 Jul 07: 850,000,000
06 Oct 07: 1,500,000,000
13 Nov 07: 2,000,000,000
17 May 08: 2,500,000,000
03 Nov 08: 3,000,000,000
04 May 09: 3,500,000,000
11 Oct 09: 4,000,000,000
18 Sept 10: 5,000,000,000
1 Aug 11: 6,000,000,000"
Source:  Blog post on Kullin.net, 9th August 2011

Thursday, 18 August 2011

Instagram has more then 7m users & just 5 employees

"After 10 months in the App Store, Instagram has grown to a community of over 7 million people. In that time, we’ve grown from 2 people to a team of 4, and today we’re excited to welcome the fifth member of the Instagram team, Jessica Zollman (@jayzombie). Jessica joins as our Community Evangelist, where she’ll help nurture all aspects of the Instagram community. That includes everything from community outreach to holding events, to writing on our blog, to helping people with their technical support issues, to helping write copy for future launches."

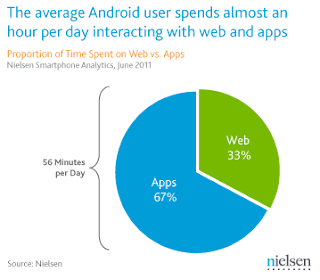
American Android users spend nearly an hour a day interacting with apps and the web through their device


Click to enlarge

Source:  Data from Nielsen, reported in their NielsenWire, 18th August 2011
Note - as ever with Nielsen there's more data in the article

72% of people active on Twitter daily publish blog posts at least once a month

"Who are Twitter users and why are they so important to your brand?
Of the users who are active on Twitter daily:
72% publish blog posts at least once a month
70% comment on others’ blog posts
61% write at least one product review a month
61% comment on news sites
56% write articles for third-party sites
53% post videos online
50% make contributions to wiki sites
48% share deals found through coupon forums
In essence: What happens on Twitter doesn’t stay on Twitter."
Source:  Data from Exact Target, reported by The Next Web, 18th August 2011

Justin Bieber earned an estimated $53m in 2010

"Justin Bieber had a very good year. Seriously, like a major one that rivals most corporate CEOs'. According to a People magazine ranking of the top-earning teen actors and musicians, Bieber, 17, raked in $53 million in 2010.
Most of that cash came from his smash movie, "Never Say Never," and his hit fragrance, "Someday." (By contrast, girlfriend Selena Gomez made $5.5 million.) Bieber reached that big-baller level thanks to the record-breaking returns from "Never," which is the most successful concert-themed film in U.S. history, with more than $73 million earned to date.
Nipping at his heels was veteran teen starlet Miley Cyrus, whose haul was $48 million, almost all of it earned from touring.
Other big earners on the list include "Twilight" top wolf Taylor Lautner, who earned $8.5 million for the final two installments of the movie series, as well as $7.5 million for his upcoming starring debut in the action thriller "Abduction.""
Source:  Data compiled by People Magazine, reported by MTV, 17th August 2011

Global Web Index - Wave 5

Showing how internet use is changing around the world.  Essential reading!

Tuesday, 16 August 2011

19% of iPhones in Sweden have Spotify installed


Click to enlarge

Source:  Blog post by Onavo, 12th August 2011

Heavy social media users tend to spend less money online


Click to enlarge

Source:  Analysis by Nick Tabbal of Resonate Networks in Forbes, 14th August 2011
Note:

"Heavy Social Media Users: people who spend an average of 26% of their online time on Social Media
Medium Social Media Users: people who spend an average of 4.1% of their online time on Social Media
Light Social Media Users: people who spend an average of 0.42% on Social Media"

Monday, 15 August 2011

British TV viewing rose to its highest ever level in H1 2011

"The average amount of television watched by UK viewers each day hit a new high in the first half of 2011, driven by factors including people watching more live TV to avoid online spoilers.
Viewers are also watching more non-live TV on personal video recorders such as Sky+.
UK viewers notched up an average of four hours and three minutes a day of TV watching in the six months to the end of June, an increase of 51 seconds a day year-on-year, according to a report published on Monday by TV marketing body Thinkbox.
Viewers were exposed to an average of 47 ads a day – up from 45 in the same period last year.
Thinkbox, which uses figures from TV audience measurement organisation Barb, said that a number of factors had fuelled the rise in overall viewing."
Source:  Analysis from Thinkbox, taken from BARB data, reported by The Guardian, 15th August 2011

Friday, 12 August 2011

14m Americans used QR codes or bar codes on their phones in June 2011


Click to enlarge

Source:  comScore MobiLens data, reported in a press release, 12th August 2011

35% of American iPad or tablet use happens in front of the TV

"Companion device usage while watching TV is big, too. 35% of tablet and iPad usage occurs in front of the television, and this is before we really have that many robust and specialized applications to truly enhance or support better TV viewing experiences. Many (including me) predict that app-enabled iPhones, tablets and iPads will be the dominant "remote controls" for home television in a few years."
Source:  Data from the Social TV Summit in LA, reported by MediaPost, 21st July 2011

92% of UK Travel purchasers use search in their purchase journey


Click to enlarge

Source:  Data from Google, reported on Google UK's Barometer blog, 8th August 2011
Full report (PDF) here

Thursday, 11 August 2011

US DVD & Blu-ray sales fell 18% Y-o-Y in H1 2011

"According to details just released by the studio-backed Digital Entertainment Group (DEG), DVDs and Blu-ray discs dropped an elephantine 18.3 percent during the first half of this year.  Overall, first-half physical sales reached $3.9 billion.
That is the total for 'packaged goods,' though Blu-rays actually inched upward 10 percent.  Which means, DVDs are positively hemorrhaging as consumers increasingly shift towards Netflix, VOD, and kiosk rentals.  In fact, this is the first period in which newer formats outsold physical formats, an inflection point with an extremely bittersweet asterisk."
Source:  Data from DEG, reported by Digital Music News, 7th August 2011

Over 30,000 companies have a presence on Chinese microblogging site Sina

"Sina national sales manager Lee would like to say that there have been over 30,000 companies settled Sina microblogging, covering the automotive, financial, FMCG and other industries. Meanwhile reporter learned, Sina Bo Enterprise has begun testing a part of different sizes in different industries have begun to try to use Enterprise Edition Sina microblogging marketing.
Since August 2009 Sina microblogging has been released, has attracted industry-wide attention and discussion. And microblogging (weibo.com) rapid growth, let it become the most influential Internet portal, to bring the marketing effect of increasing, gradually changing the depth of marketing."
Source:  Sina News, 8th July 2011, translated through Google Translate

Groupon's quarterly losses trebled Y-o-Y in Q2 2011

"Daily deals juggernaut Groupon managed to significantly slash marketing costs last quarter, but its net loss in the second quarter of this year has almost tripled compared to last year as it hired more than 1,000 new employees, according to an SEC filing published this morning. Basically, the company is still growing like gangbusters but losing money like crazy in the process.
The updated financial details show that Groupon increased revenue from $3.3 million in Q2 2009 to $878 million in the second quarter of 2011, while net income swung from $21,000 for the second quarter of 2009 to a staggering net loss of $102.7 million for the second quarter of 2011.
The reported net loss is in line with the first quarter of 2011 but nearly triple the $36 million loss from Q2 2010. Groupon hired more than 1,000 employees in the 3-month period – growing its sales force to more than 4,800 people – which caused a serious bump in ‘general and administrative expenses’.
In total, Groupon grew from 37 employees as of June 2009 to 9,625 employees as of June 2011."
Source:  SEC filing from Groupon, reported by TechCrunch, 10th August 2011

Only 20% of Groupon subscribers have ever made a purchase

"Here’s the deal:
Groupon had 115.7 million subscribers at the end of June.
Of those subscribers, only about 20 percent — or 23 million — have ever made a purchase. Those are called cumulative customers.
The average subscriber (not customer) spent $18 in the first half of the year, down from $21 last year.
The average customer over the lifetime of a membership has purchased four Groupons, up from three a year ago.
The average revenue per Groupon sold in the first half of the year was $25, up from $23 in the same period 2010.
The number of merchants Groupon worked with in the first half of 2011 increased to 135,247, up from only 12,468 in the first half of 2010.
Converting subscribers into customers will be key for Groupon in order to justify its high marketing costs."
Source:  Figures revealed by Groupon as part of it's Q2 2011 results, reported by AllThingsD, 10th August 2011

Wednesday, 10 August 2011

98% of Affluent Americans use the internet

"IAB found that 98 percent of affluent consumers use the Internet, compared with 79 percent of the general population. Wealthy Americans spend around 26 hours online each week, 18 hours watching TV and about eight hours listening to the radio. The general population, on the other hand, spends about twice as much time weekly with TV and radio – 34 hours and 16 hours, respectively – and just about 22 hours on the Internet.
Other key data points show affluent users are just as capable of advertising recall. Eighty-eight percent of affluent consumers recalled being exposed to at least one digital ad during the previous week, compared with 84 percent of non-affluent Internet users. Within these groups, affluents recalled 21.1 ads on average, versus 20.2 for other groups."
Source:  Data from the IAB, reported by Venture Beat, 1st August 2011
Note - "The study defines “affluent Americans” as people with at least $100,000 annual incomes. They comprise 21 percent of U.S. households, have 70 percent of all consumer wealth, and spend 3.2 times more than other Americans on purchases."  (So that's household income, presumably)

Nearly half of all American singles have tried online dating (estimate)

"Online dating has come of age. Once a seedy corner of the internet, digital romance is today nearly as commonplace as e-commerce. Of the 87 million singles in the US, nearly half of them, or 40 million, have tried online dating, according to the US Census. Some surveys estimate that one in five new relationships, and one in six new ­marriages, begins online. “This is one of those businesses where scale really ­matters,” says Ginsberg, noting that Match has facilitated 1.2 billion e-mails since 2005, and 110 million virtual winks [a way for members to “break the ice” before e-mailing] in the past six months. She also says there is no reason to expect growth to stall any time soon, as online dating becomes more mainstream and new singles of all ages come online. “With the divorce rate in this country being 50 per cent, we’re a ­reflection of that society,” she says."

UK riots led to the highest ever British usage figures for Twitter

"Although people were glued to the news sites for updates on the unrest, it was Twitter which has benefited the most from traffic as a result of the unrest in London. The real-time sharing of information through Twitter has made the platform the ideal discussion platform to spread updates on major news events like the riots, and yesterday (8 August) was Twitter’s biggest ever spike in UK traffic online.
Twitter accounted for 1 in every 170 UK Internet visits yesterday; by our estimations there were over 3.4 million visits to the Twitter homepage from the UK population alone. To put that in context, Twitter received 15% more visits yesterday than it did around the super-injunctions scandal, the previous biggest spike in its UK history.
Somewhat unusually, the spike in traffic to Twitter was not repeated on other social media websites, especially Facebook. Looking at our postcode data helps to explain why this might be. Twitter is used widely across the UK but the most prolific Twitter users are located in London postcodes."
Source:  Data from Hitwise, reported on their blog, 9th august 2011

Tuesday, 9 August 2011

82% of American Groupon merchants are unsatisfied with repeat business from coupon users


Satisfied 17%
Unsatisfied 82%
Unsure 1%


Click to enlarge

Source:  Based on 300 telephone interviews by CM Copywriters, 12th July 2011
Note - more stats and charts in the original article

Thursday, 4 August 2011

Key Ofcom stats for the UK

"Internet
Number of fixed residential broadband connections in the UK - 18.0 million (end 2010).
Proportion of adults with broadband in the UK (fixed + mobile) - 74% (Q1 2011)
Proportion of adults with mobile broadband in the UK - 17% (Q1 2011)
Proportion of adults with a social networking profile - 48% (Q1 2011)
Proportion of people who use their mobile to access the internet -  32% (Q1 2011)
Number of mobile broadband (Dongles/PC datacard) subscriptions - 4.8 million (end 2010)
Landline/mobile phones
Number of residential fixed landlines in the UK - 23.7 million (end 2010)
Number of fixed landlines in the UK, including ISDN channels - 33.4 million (end 2010)
Proportion of adults who personally own/use a mobile phone in the UK - 91% (Q1 2011)
Proportion of adults who live in a home that has a mobile phone but no landline phone in the UK - 15% (Q1 2011)
How many PAYG mobile subscriptions in the UK ? - 51% (Q1 2011)
Number of text messages sent per mobile subscription per month - 133 (in 2010)
Number of 3G mobile subscriptions in the UK - 33.1 million (end 2010)
Digital television
Proportion of UK homes with digital TV 93% (Q1 2011)
Number of TVs in the UK 60m (end 2010)
Number of HD TVs in the UK - 24m (Q1 2010)
Number of minutes of TV people aged 4+ watch each day - 242 (average in 2010)
Number of UK homes with Freeview on any set - 74% (Q1 2011)
Proportion of UK homes with Freeview on their main set - 38% (Q1 2011)
Digital radio
Proportion of households with access to a DAB Digital Radio - 37% (Q1 2011)
Proportion of listener hours through a digital platform (DAB, online, DTV) - 26.5% (Q1 2011)
Number of digital radio stations - 216 (end 2009)
Number of local radio stations (excluding community stations) - 344 (July2011)
Number of national radio stations - 21 (July 2011)"
Source:  Ofcom's latest facts and figures on the UK, retrieved 4th August 2011

27% of UK adults, and 47% of UK teenagers, own a smartphone

"New Ofcom research reveals the extent to which the UK has become addicted to smartphones, with people confessing to using them everywhere from the dining table to the bathroom and bedroom.
Over a quarter of adults (27 per cent) and almost half of teenagers (47 per cent) now own a smartphone, according to Ofcom’s latest Communications Market Report.
Most (59 per cent) have acquired their smartphone, which includes devices such as iPhones, Blackberrys and Android phones, over the past year.
Users make significantly more calls and send more texts than regular mobile users (81 per cent of smartphone users make calls every day compared with 53 per cent of ‘regular’ users).
Teenagers especially are ditching more traditional activities in favour of their smartphone, with 23 per cent claiming to watch less TV and 15 per cent admitting they read fewer books.
And when asked about the use of these devices, 37 per cent of adults and 60 per cent of teens admit they are ‘highly addicted’."
Source:  Data from the Ofcom Communications Market 2011 report, as summarised on their website, 4th August 2011
Full Report available here

Wednesday, 3 August 2011

An appearance on Dragon's Den generated 1.4m 'hits' for ThePresentClub

"I'm so disappointed that the website crashed last night, we receievd 1.4 million hits, not bad for 4.3 million viewers of Dragons' Den."
Source:  Georgette Hewitt, Founder of The Present Club, writing on Facebook, 1st August 2011
Note:  'Hits'..?  Let's assume she means page impressions.  The site apparently went down as a result of all the traffic while the programme was on air

Twitter is valued at $8bn

"Twitter, the microblogging website that lets users tweet messages of 140 characters or less, is now worth $8bn (£4.9bn). The firm's new price tag comes after a $400m investment in the loss-making venture from serial social media investor DST Global. Twitter is now nominally worth about the same as rating agency Moody's, which had revenues of $1.2bn in the first six months of 2011 and is nearly as valuable as Marks & Spencer.
The huge valuation reflects high expectations for the company. Confirming the investment, Twitter also announced that its users now send 200m tweets a day, up from 65m a year ago."

Tuesday, 2 August 2011

Mobile payments company Square is processing $4m in payments each day

"Flush with $100 million in new funding, Square is continuing to grow like a weed in the mobile payments space. After passing the $3 million mark at the end of May, Square is now processing $4 million in mobile payments daily, and is on track to reach over $100 million in transactions in July. And COO Keith Rabois tells us that he expects the company to double this volume by October."
Source:  Techcrunch, 31st July 2011

22% of US homes own an HDTV with integrated apps

"Over 60% of Internet-connected TV households use TV apps at least once per week, according to Scottsdale, Ariz.-based In-Stat. New wave TVs allow consumers to connect with Netflix, YouTube, Facebook, and more.
"As expected, Netflix and YouTube currently dominate the TV application space," says Keith Nissen, research director at In-Stat. "But as Netflix competitors become more numerous and as applications are optimized for the big screen, TV apps will become part of the mainstream TV viewing experience."
Right now, In-Stat says 22% of U.S. TV households already own an HDTV with integrated TV apps. Connected TVs with integrated TV applications will grow by an average 36% over the next five years."
Source:  Data from In-Stat, reported by MediaPost, 26th July 2011

Apple makes 66% of all mobile phone manufacturer profilts


Click to enlarge

"The last graph, which compares the profit pie from 2007 and 2011, is most revealing. Back then, Apple only had one percent of all operating profits while Nokia had 55 percent, at the time the pie was shared between eight major players. Compare that to last quarter, when Apple captured 66 percent of a profit pie split between only four players: Apple, Samsung, RIM, and HTC."
Source:  Data from Asymco, reported by PCMag, 1st August 2011

Monday, 1 August 2011

Official YouTube Statistics

"Traffic
More than 13 million hours of video were uploaded during 2010 and 48 hours of video are uploaded every minute, resulting in nearly 8 years of content uploaded every day
Over 3 billion videos are viewed a day
Users upload the equivalent of 240,000 full-length films every week
More video is uploaded to YouTube in one month than the 3 major US networks created in 60 years
70% of YouTube traffic comes from outside the US
YouTube is localised in 25 countries across 43 languages
YouTube's demographic is broad: 18-54 years old
YouTube reached over 700 billion playbacks in 2010
YouTube Partner Programme
Created in 2007, we now have 20,000+ partners from 22 countries around the world
We pay out millions of dollars a year to partners
Hundreds of partners are making six figures a year and the number of partners making over USD1,000 a month is up 300% since 2010
Monetisation
YouTube is monetising over 3 billion video views per week globally
98 of AdAge's Top 100 advertisers have run campaigns on YouTube and the Google Display Network
The number of advertisers using display ads on YouTube increased tenfold in the last year
Product Metrics
We have more HD content than any other online video site
We have thousands of full-length films on YouTube
10% of YouTube's videos are available in HD
YouTube mobile gets over 320 M views a day (up 3x year/year), representing 10% of our daily views
The YouTube player is embedded across tens of millions of websites
Content ID
Content ID scans over 100 years of video every day
More than 2,000 partners use Content ID, including every major US network broadcaster, film studio and record label
We have more than six million reference files (over 300,000 hours of material) in our Content ID database; it's among the most comprehensive in the world. The number has doubled in the last year
Over a third of YouTube's total monetised views come from Content ID
More than 120 million videos have been claimed by Content ID
Social
Nearly 17 million people have connected their YouTube account to at least one social service (Facebook, Twitter, Orkut, Buzz, etc.)
Over 12 million people are connected and auto-sharing to at least one social network
150 years of YouTube video are watched every day on Facebook (up 2.5x year/year) and every minute more than 500 tweets contain YouTube links (up 3x y/y)
100 million people take a social action on YouTube (likes, shares, comments, etc.) every week
An auto-shared tweet results in 6 new youtube.com sessions on average and we see more than 500 tweets per minute containing a YouTube link
Millions of subscriptions happen each day. Subscriptions allow you to connect with someone you're interested in &endash; whether it's a friend or the NBA &endash; and keep up with their activity on the site
More than 50% of videos on YouTube have been rated or include comments from the community
Millions of videos are favourited every day"
Source:  YouTube press statistics, retrieved 1st August 2011

YouTube accounts for almost a quarter of all global mobile data bandwidth

"Close to a quarter of all global mobile bandwidth is consumed by people watching YouTube videos, according to a new report from network management vendor Allot Communications. The global bandwidth share of the Google-owned video site was 22 percent in the first half of 2011, compared with just 17 percent in the first half of 2010. YouTube now accounts for 52 percent of all global mobile video streaming, according to Allot.
Overall, video streaming now accounts for 39 percent of all mobile traffic. File sharing, which includes both P2P file transfers and downloads from one-click host sites like MegaUpload and RapidShare, is a distant second with 29 percent, and web browsing accounts for 25 percent of all mobile traffic."
Source:  Data from Allot Communications, reported by GigaOM, 26th July 2011

Samsung sold 5m Galaxy S II phones in 85 days

"Samsung's Galaxy S II smartphone has racked up record sales even before it's hit the hot U.S. market.
The Korean mobile-phone maker said yesterday that it sold more than 5 million units of the Galaxy S II in the 85 days following its debut. Announcing the sales on its Samsung Tomorrow page (Google Translate English version), Samsung said that the phone has captured the top market share among more than 10 countries in Europe.
In comparison, the original Galaxy S took 125 days to reach the same 5-million-unit sales mark.
The GS II launched in its home base of South Korea on April 29 before reaching Japan and several European countries in May. The popular phone claimed more than 3 million in unit sales just one month after its release, according to Samsung, with 2 million selling in some of the larger markets."

Mobile usage in the big 5 markets in Europe


Click to enlarge

Source:  Data from comScore MobiLens, reported in a press release, 29th July 2011
Note - lots more data in the full press release

How Netflix and Hulu viewing differs


click to enlarge

Source:  Data from Nielsen, reported on NielsenWire, 27th July 2011
Note 1 -  "Nielsen completed more than 12,000 online interviews in March 2011, focusing on usage and attitudes for over-the-top video, particularly Netflix and Hulu."
Note 2 - The full report also looks at what the users view - e.g. films vs. TV shows.

US smartphone operating system & manufacturer share


Click to enlarge

Source:  Data from Nielsen for June 2011, using pre-pay users only, NielsenWire, 28th July 2011